Server Response Time Explained for Site Owners
Server response time (TTFB) explained: how to measure time to first byte, what a good number looks like, and the fixes that reduce it.
By Matthew Zhao · Editor, Hosted EZ

Server response time is the pause between a visitor requesting a page and your server sending the first byte of the answer — measured as TTFB, time to first byte. Every image, script, and font on the page waits behind it. This guide covers how to measure it honestly, what a reasonable number looks like in 2026, and which fixes actually help.
Read how to choose a web host if you are still picking the broader setup, and our guide to migrating hosts without downtime before changing live infrastructure.
Measure time to first byte before you change anything
Measure the page before you change it. Check a repeat visit as well as a first visit, and keep the test location consistent — otherwise a change in the test can look like an improvement in the site.
Note the numbers, the URL, and the tool you used. TTFB varies by page: a cached homepage can look great while search results or logged-in pages do the hard work every time.
Be aware of what your tool includes in the number. Some report TTFB with DNS lookup and TLS handshake time folded in, while others start counting only after the connection exists — the same server can look half a second slower in one tool than another. Pick one tool and stay with it for the whole exercise.
How to reduce server response time
Work from the biggest delay toward the small ones. A slow first byte, uncompressed images, a cache miss, and a large script each need a different fix; they do not become one problem because a speed test lists them together.
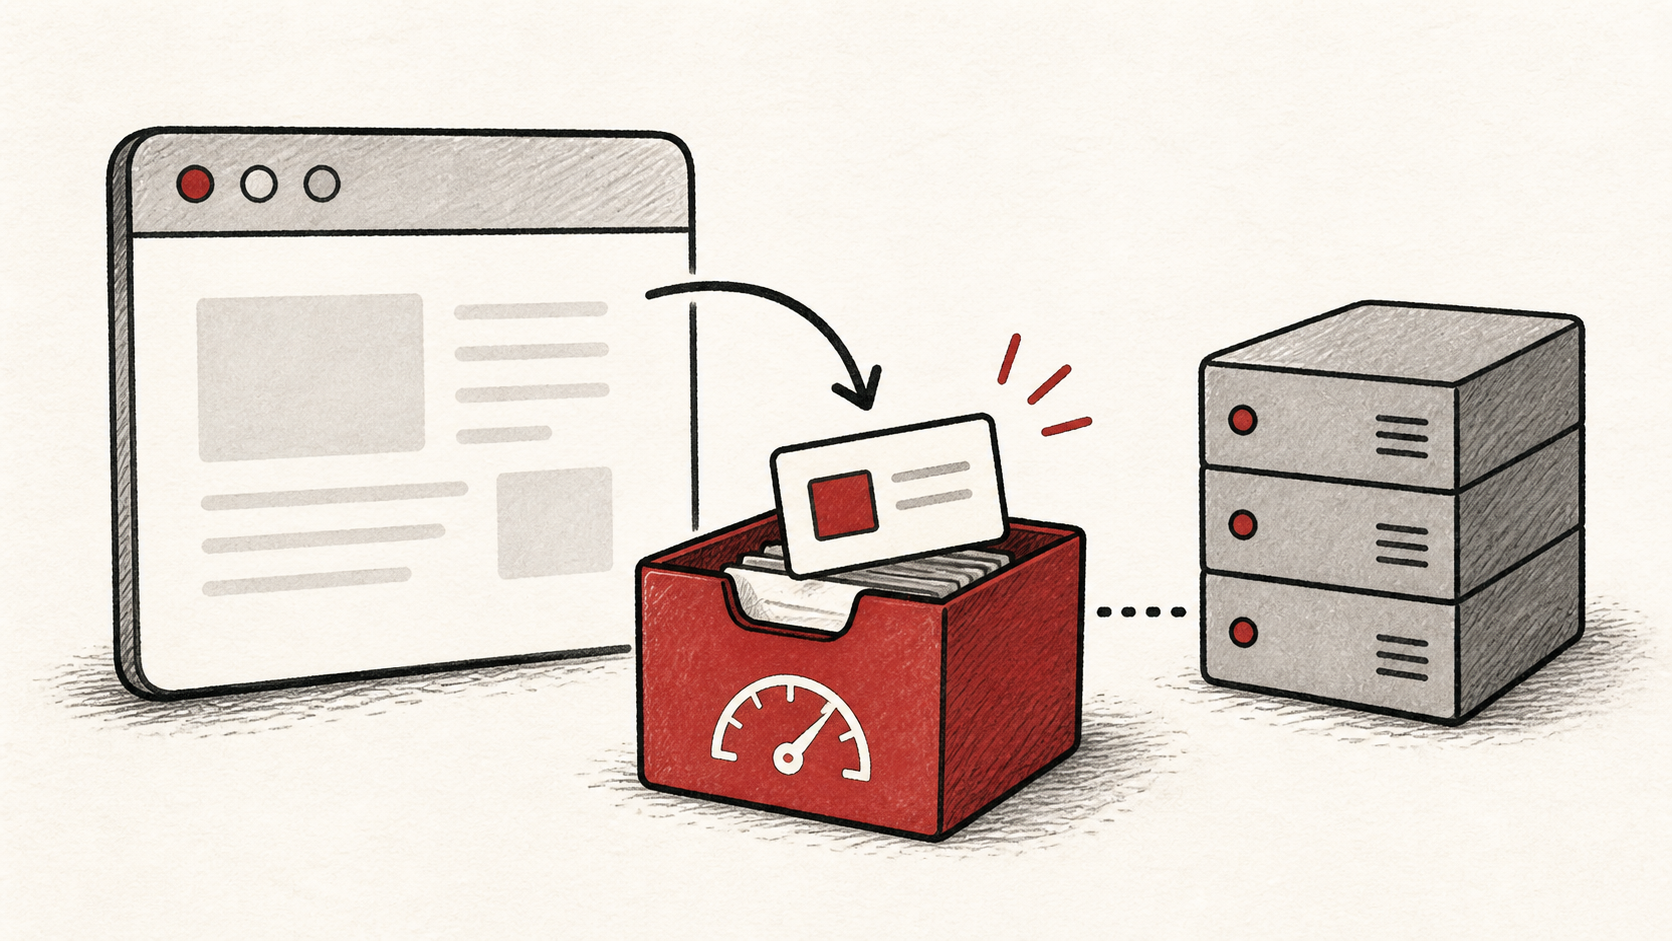
To reduce server response time specifically, look in this order: page caching, so the server skips the work entirely; the application's own work per request, such as slow database queries or heavy plugins; the PHP or runtime version; and finally physical distance between server and visitor.
Server response time also sits underneath your Core Web Vitals — a slow first byte drags LCP down before your page has done anything wrong.
Test the result like a visitor
Verify the change with real pages and common devices. A cache can make a homepage fast while product pages, search, or logged-in routes still miss it every time.
Use a private window or a second device after each change, and test the page with the most consequence first. One question per test.
When to stop and ask for help
Stop when the next action could overwrite data or remove access to the account — server-level caching and PHP changes can take a site down. Send support the domain, exact URL, UTC time, your measurements, and the changes you made, but never private keys, passwords, or payment information.
web.dev's Core Web Vitals guide has useful background on how TTFB fits the bigger performance picture. Use it to understand the terms, then return to the small, reversible next step.
A sensible maintenance habit
Keep a dated note of the numbers: the TTFB you started with, what you changed, and where it landed. Performance work without a baseline is guesswork, and next year's "the site feels slow" becomes answerable in one lookup.
Keep the change auditable
Record each change with its before-and-after measurement — cache enabled, PHP updated, plugin removed — and the time. If a change involves a cache, note when it expires so you do not measure the old configuration by mistake.
Do not confuse a hosting dashboard's uptime graph with what visitors experience. A server can be up and still slow. Measure from outside the account, from roughly where your visitors are.
If you hand the work to someone else, give them the measurements rather than a conclusion. "The site is slow" is hard to investigate; a URL, a number, and a date is a starting point.
One last check
Before moving on, run the same measurement from the same place one more time, on the site's slowest meaningful page rather than only the homepage. If the number did not move, the bottleneck was somewhere else — keep working down the list.
Leave a useful handoff
Save the final measurements with the date and configuration. When the number creeps up again — it always creeps — the note tells the next person what fast looked like and what produced it.
Bottom line
Server response time responds to a short list of fixes: cache what can be cached, cut the work per request, keep the runtime current, and host near your visitors. Measure before and after, one change at a time.
Frequently asked questions
What is a good time to first byte?
As a working target in 2026, aim under roughly 0.8 seconds — the same ballpark web.dev's TTFB guidance uses. Past a couple of seconds, look hard at hosting and caching.
Does a CDN fix a slow first byte?
Only for the pages it can cache. A CDN serves cached copies from a location near the visitor, which makes the first byte fast for static pages and assets. Requests it cannot cache — logged-in pages, carts, site search — still travel to your origin server and wait for it, so a slow application stays slow behind a fast CDN.
Do I need to fix everything a speed test lists at once?
No. Change one thing — enable a cache, update PHP — measure TTFB again, and keep the previous configuration until you know the result is stable.
What should I give hosting support about slow responses?
The domain, exact URL, UTC time, your measurements, and steps already tried. Numbers from a consistent tool beat "the site is slow" by a wide margin.
Should I keep a backup before performance changes?
Yes. Verify a recent backup before edits that affect files, databases, or software versions — caching plugins and PHP upgrades occasionally break things.
About the author
Matthew Zhao
Matthew has spent his career running production server fleets — tens of thousands of machines' worth. He writes about hosting the way he wishes someone had explained it to him: plainly.
About Hosted EZ →Get the next guide in your inbox
One email when we publish something worth your time. No spam, unsubscribe whenever.